Showing posts with label AuroraWatch UK. Show all posts

Saturday, 19 August 2017

Using the Raspberry Pi sense hat to show the AuroraWatch UK status

Image © Barry Osborne 2017. Used with permission.


This post uses the Raspberry Pi sense hat to display the AuroraWatch UK alert status. It assumes you already have Raspbian installed on a Raspberry Pi, networking configured and enabled, and the sense hat fitted to the Pi.

The current status level is easily obtained from the AuroraWatch UK API with a custom python module. First, ensure you have the necessary python modules installed from the Raspbian software archive:

sudo apt-get update
sudo apt-get install python-lxml python-requests python-six

Then install two custom python modules. We will install them into the user profile, so run these commands as the user pi:

pip install --user --no-deps atomiccreate
pip install --user --no-deps aurorawatchuk

Finally, download the python script which fetches the status and displays it on the sense hat (I used bit.ly to shorten the original GitHub URL):

wget https://bit.ly/awuk-status-on-sense-hat -O awuk_sense_hat.py

The AuroraWatch UK status can then be displayed on the sense hat with this simple command:

python awuk_sense_hat.py

The program will monitor the current status and set the LED colours to show the status level (green, yellow, amber or red). For more information about the AuroraWatch UK status level meaning and interpretation see http://aurorawatch.lancs.ac.uk/alerts/. If you don't have a sense hat (I don't) it is even possible to try this with the sense hat emulator.

Credits

The geomagnetic activity status is courtesy of AuroraWatch UK and uses data from the SAMNET and AuroraWatchNet magnetometers.See also the AuroraWatch UK conditions of use for the API.

Thanks to Barry Osborne for testing the software with a real Raspberry Pi sense hat, and for providing the photograph.

Sunday, 19 February 2017

AuroraWatch UK camera update #2

A Python module for the AuroraWatch UK API

The first goal in the journey to create an automated all-sky camera system for AuroraWatch UK was to interface to the camera using Python. If you missed update #1 you can read it at here.

One of the requirements of the camera software is to be able to change between different recording settings, for instance, in response to solar elevation and the AuroraWatch UK status level. Computing solar elevation is easily acheived with the astral module. For the AuroraWatch UK status level I began with fetching the status XML document but soon realised a much better approach was to write a Python module. The module automatically fetches the various XML documents, parses them and caches the results, both to memory and to disk.

I won't repeat the instructions for installing and using the module - that information is already given in an ipython notebook that you can view at https://github.com/stevemarple/python-aurorawatchuk/blob/master/aurorawatchuk/examples/aurorawatchuk_api.ipynb. 

Wednesday, 28 December 2016

AuroraWatch UK camera update #1


ZWO ASI 174MC colour USB 3.0 camera. Image from ZWO website.
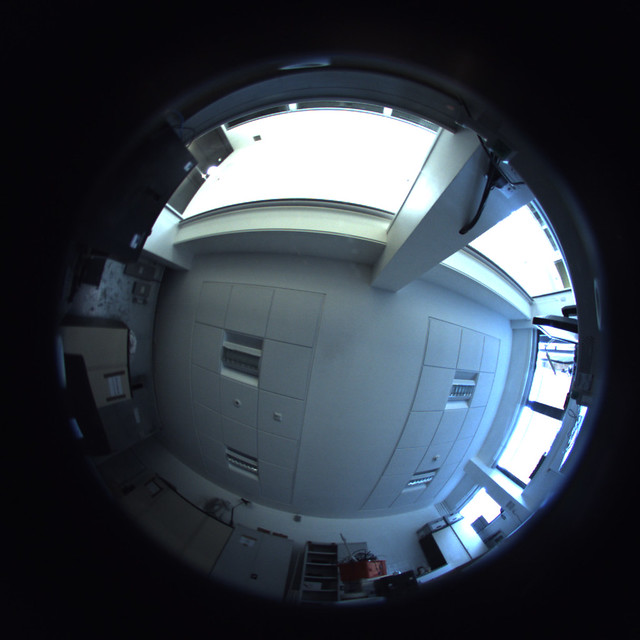
Recently AuroraWatch UK purchased a ZWO ASI174MC colour USB 3.0 camera to (hopefully) record images of the aurora. The aim is to build an all-sky imager. To minimise the cost the camera will be connected to a Raspberry Pi single-board computer and be located outside in a waterproof enclosure. This particular camera was chosen for several reasons:
  • No mechanical shutter to wear out. 
  • The large pixel size (5.86um) should give good sensitivity. 
  • The sensor has an IR cut-off filter fitted (filters cannot be used with the fish-eye lens). 
  • The manufacturer provides support to access the camera from Linux. 
At present the Linux support from ZWO is limited to a software development kit (SDK) which provides a C language library and header file. This is sufficient for a Raspberry Pi to be able to interface with the camera. However my preferred approach is to write the image capture and control software in Python since that will simplify development and access to the AuroraWatch UK API. I therefore decided to write a Python wrapper for the C library. This is not something I have done before and after a little experimentation with ctypes, Cython and CFFI and I settled on using ctypes. You can find the source code for my Python wrapper on Github. It's also available on pypi so you can install it simply by running "pip install zwoasi".

I've written a short demo program to illustrate how to access the camera from Python. The camera can operate in two modes. The first, snapshot mode, takes a single exposure. The second, video mode,  continually takes exposures which can be downloaded from the camera as and when required. At first glance either mode would appear suitable for the purpose of taking a single exposure once a minute. My main concern is how to set the exposure correctly for an automated system which will run in a variety of different lighting levels (twilight, nighttime, and possibly even daytime). Fortunately this particularly camera provides an auto-exposure mode which can adjust the exposure time and gain settings according to the ambient light levels. It does this by analysing the image histogram after each exposure. The documentation doesn't explain the auto-exposure mode but I suspected that the camera would have to be operated in video mode for this to work. A quick test proved this to be correct. How well the auto-exposure algorithm works at night has yet to be discovered; since it is an astronomy camera I'm optimistic that it will be suitable and save me from having to implement an exposure control algorithm.

Sample ASI174MC image
Sample image from ASI174MC and Fukinon FE185C057HA-1 2/3" fisheye lens.
The complete control system is intended to timestamp and watermark images, change the recording cadence according to AuroraWatch UK status and solar elevation, record temperature and humidity, and control heating and fans.


Monday, 24 March 2014

Power over ethernet (PoE) magnetometer and cloud detector

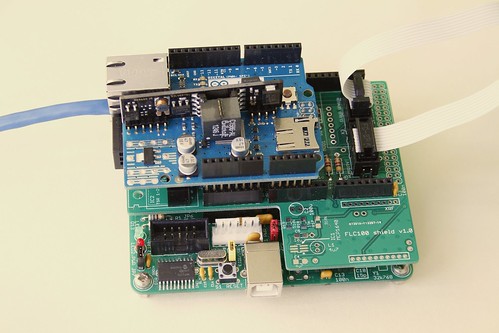
Combined magnetometer and cloud detector
Combined magnetometer and cloud detector.


To improve the performance and stability of the AuroraWatchNet magnetometers I recently began experimenting with a power over ethernet (PoE) version. With restrictions on power consumption lifted considerable performance improvements are possible. As a result I have developed the magnetometer hardware specifically to support a power over ethernet version. Another instrument I've been developing is a cloud detector. This too should benefit from a power over ethernet version. One problem I encountered was with dew settling on the sensor but fitting a heater is incompatible with battery-powered operation. Since both the magnetometer and cloud detector use almost the same hardware I decided to design an Arduino-compatible 'shield' that could be used to support both systems.

Combined magnetometer and cloud detector hardware

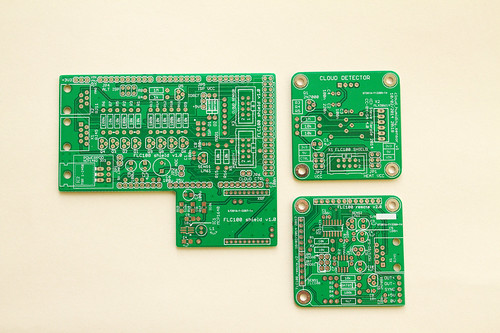
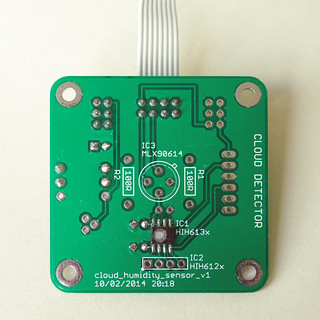
Combined magnetometer and cloud detector PCBs
Printed circuit boards for the sensor shield (left), the IR or humidity sensor (top right)
and fluxgate magnetometer (bottom right). Click for annotated version.
The complete system requires six circuit boards (five for the wireless version). The first is the microcontroller board, I use my Calunium Arduino clone. I hope that in future it will be possible to use an off-the-shelf Arduino Mega2560 instead but the current firmware relies on Calunium's real-time clock to generate the hardware interrupts which control the sampling interval. There is also a sensor shield, the Arduino Ethernet shield (omitted on the battery-powered wireless version), and one board for each of the sensors (fluxgate magnetometer, IR temperature and humidity).

The sensor shield is based on the existing design and retains the option of battery-powered operation with radio communication. The magnetometer sensor and analogue-to-digital converter must be powered at 5V, which requires a level-shifting circuit when the microcontroller is powered from 3.3V, which is the case when operating from batteries. For power over ethernet use the microcontroller must also operate at 5V for compatibility with the Arduino Ethernet shield so the level shifting is not required. It is kept however as it provides buffering between the two circuit boards; 1.5m is a considerable distance for an I2C bus. The cloud detector uses a non-contact infra-red temperature sensor operating at 3.3V so a level-shifting circuit is required for PoE operation where the microcontroller is connected to 5V. (I've ignored the fact that a 5V version of the sensor exists since it isn't readily available in the UK). The sensor shield allows a humidity sensor to be connected so that estimates of the clear sky and cloudy sky temperatures can be made. As before, an on-board LM61 temperature sensor monitors the system temperature. The new sensor shield also adds a header to fit an Embedded Adventures lightning sensor module. I don't have one of these at the moment so I can't be certain it will work and there is no software support for it in the existing firmware. Fitting it at the same time as the cloud detector sensors will require long break-away headers to be soldered to the bottom of the lightning sensor module.

Fluxgate magnetometer sensor PCB
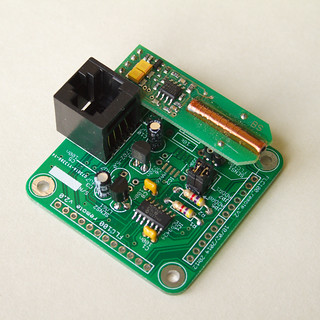
Fluxgate magnetometer sensor mounted on its sensor PCB.
Click for annotated version.

The fluxgate sensor is fitted on its own PCB which contains the analogue to digital converter. For PoE operation a linear voltage regulator is used to convert from 9V to the 5V supply it requires. For battery operation a MAX619 DC-DC charge pump boosts the battery voltage to 5V. Almost all of the temperature variation can be removed by placing the PCB at the bottom of a 1m length of soil pipe. The pipe is buried to a depth of 0.85m with its axis vertical. In the magnetometer-only system the microcontroller, sensor shield and ethernet shield (or batteries for the wireless version) are fitted onto a wooden frame to hold them into the top part of the tube. Positioning the rest of the system away from the fluxgate sensor helps to avoid unwanted effects from any ferro-magnetic components (such as the batteries), it also aids access and enables wireless data transmission.

Humidity sensor PCB
Honeywell HIH6131 humidity sensor mounte on its sensor PCB.
The same PCB design is also used for the MLX90614 IR temperature sensor.
Click for annotated version.

The enclosure design used for the magnetometer isn't suitable for the cloud detector so the prototype cloud detector used a standard IP65 rated box, with the IR temperature sensor pointing upwards to view the sky. The humidity sensor was fitted above a breather hole in the bottom of the box. This concept will continue to be used for the cloud detector; the IR temperature sensor and humidity sensor are fitted to separate PCBs in the top and bottom of the box. To minimise costs the IR temperature and humidity sensors use the same PCB design. The mechanical design of the cloud detector part is something I'd like to improve upon, particularly to reduce the number of PCBs used. However the differing sensor requirements may prevent this.

For a combined system I plan to use the soil pipe to house the fluxgate sensor but locate the rest of the electronics in a separate box following the design of the prototype cloud detector.

Does it work?

I've not yet deployed a system outside but testing indicates the new printed circuit boards work as intended when used in power over ethernet mode. Battery-powered operation on this new version has not yet been tested.

Design files

The design files (hardware, firmware and software) are open source and can all be downloaded from the Github repository. A PDF version of the user manual describing how to construct and operate the magnetometer can be downloaded from http://aurorawatch.lancs.ac.uk/manual.pdf. At the time of writing only instructions to build the original FLC100 shield are included. Instructions to build the combined sensor shield described above will be added in due course.


Wednesday, 12 February 2014

Performance comparison of power over ethernet (PoE) and battery magnetometers

Introduction

I've been working to improve the performance and stability of the AuroraWatchNet magnetometers. It's apparent that both measurement noise and stability are considerably improved when the sensor is powered continually. Unfortunately with the sensor powered continually the batteries last for only a few weeks. I have therefore been testing a power over ethernet (PoE) version of the magnetometer. The hardware is essentially the same but the addition of the Arduino Ethernet shield requires the microcontroller to operate from 5V. Operating voltage is easily changed on my Calunium microcontroller board. With the power restrictions lifted the sampling interval can also be reduced. The test system has been operating reliably for almost two months, sampling every 5 seconds. With some minor configuration changes sampling every second is possible although I am not convinced the trade-off in measurement noise is worthwhile.

Performance comparison

Below is a plot comparing one hour of data from the new power over ethernet system with two of the existing battery-powered wireless models already in operation. The PoE system is on the same site as LAN1 but located nearer parked cars. I chose this period because it was free of man-made disturbances. I adjusted the baselines so that the plots overlap.Only the H component of the magnetic field is shown.

Power over ethernet compared with existing AWN magnetometers
Click for larger version.

The graph shows that the power over ethernet version has much smaller measurement errors; it can probably operate with ~0.1nT accuracy compared to ~10nT for the battery-powered version. It's such an improvement that I found the measurement accuracy was being limited by the available resolution of the analogue-to-digital converter. The battery-powered versions derive the sample value from the median of 15 samples (taken as a burst over 4 seconds) to reduce noise. To improve the resolution for the PoE version it operates by taking the mean of 15 samples. Further improvement to the resolution may be possible by taking advantage of the programmable gain amplifier that is built into the analogue-to-digital converter.

Let's see how it compares against some observatory-grade measurements. The plot below shows the same interval but this time uses data from the British Geological Survey magnetometers at Eskdalemuir and Hartland. I obtained the data from the SAMNET data archive at Lancaster University, where the data has already been converted into HEZ magnetic coordinates. AuroraWatchNet also operates with HEZ magnetic coordinates, although usually the E and Z sensors are not present. As before, the baselines have been adjusted so that the plots overlap.


PoE magnetometer compared with BGS magnetometers
Click for larger version.


The similarity between the different traces is striking. Some differences are to be expected since Eskdalemuir is approximately 140km north of Lancaster and Hartland is 350km SSW of Lancaster. This interval is interesting because it shows Pi2 pulsations, starting at about 01:15 and ending around 01:30. The period of the pulsations are about 90 to 120 seconds.

Conclusions

For a home-built citizen-science magnetometer which probably costs 25 times less than its observatory grade cousin I'm very happy with its performance. The detection of Pi2 pulsations means a low-cost magnetometer can now notify of substorm onset, not just the arrival of geomagnetic storms. A network of such devices has interesting possibilities for the study of magnetic field line resonances.

You might wonder why anyone would want to buy an observatory grade instrument, there are good reasons. At present I am relying on the sensor manufacturer's calibration, whilst an observatory grade instrument would be supplied with an official calibration certificate. The observatory instrument would also have better long-term baseline stability, lower temperature variation and higher cadence. Calibration is an issue I hope to tackle at a later date. For space-weather monitoring only short-term variations are of interest and
the better performance provided by an observatory system may not be needed.

Data credits

The Sub-Auroral Magnetometer Network data (SAMNET) is operated by the Space Plasma Environment and Radio Science (SPEARS) group, Department of Physics, Lancaster University. Hartland and Eskdalemuir data is provided courtesy of the British Geological Survey.


Thursday, 26 September 2013

Auroraplot: data processing software for AuroraWatchNet

With the dispatch of the AuroraWatch schools' magnetometers imminent I have implemented a  Python  toolkit to process the data. The numpy and matplotlib modules are used extensively. The toolkit provides an API to load data and perform various processing actions on it, such as plotting data. The concept is influenced by my previous Multi-instrument Analysis toolbox for Matlab. In addition to the loading and processing of magnetic field data auroraplot allows other data types to be added later.

Loading data

Data can be loaded with arbitrary start and end times very simply:

md = ap.load_data('AURORAWATCHNET', 'LAN1', 'MagData',
                  np.datetime64('2013-09-20T12:00:00+0000'),
                  np.datetime64('2013-09-21T12:00:00+0000'))


In this case the selected portion of data crosses midnight and two data files must be loaded, concatenated and trimmed to get the desired time range. This is performed automatically by auroraplot, the user need not be concerned with the format of the files or where they are located. It is even possible for the files to be downloaded on-the-fly using FTP or HTTP transfer protocols.

load_data returns an object (of type MagData) to the user containing the actual magnetic field data and various other metadata, such as a timestamp for each sample and the data units. Each object can store more multiple data channels but all data points must share the same timestamps, be of the same type and share the same units. Therefore it is not possible to store operating temperatures (units °C) in an object holding magnetic field strength (units tesla). The operating temperature data can be accessed as:

td = ap.load_data('AURORAWATCHNET', 'LAN1', 'TemperatureData',
                  np.datetime64('2013-09-20T12:00:00+0000'),
                  np.datetime64('2013-09-21T12:00:00+0000'))


Battery voltage (data type VoltageData) can be accessed in a similar same way.

Plotting data

High-level plot functions enable the data be be plotted very simply, for the magnetic field data loaded previously

md.plot()


will produce a matplotlib figure with a title and the axes labelled with the correct units. Temperature and voltage data are plotted in the same way.

I have created some tools to make working with numpy's datetime64 and timedelta64 objects more convenient, including rounding functions (round, ceil and floor) which round to an interval. They are useful for finding the start of an hour, or the end of a day. I have also created Locator and Formatter classes to sensibly label time axes using datetime64 times and timedelta64 intervals. Tick marks are located on the nearest second, minute, hour, day, month or year boundary (or multiple thereof) depending on the time interval being displayed. Thanks to matplotlib's structure the labels are automatically regenerated with the most appropriate time units when a plot is zoomed.

Other operations

Quiet-day curves

Other operations include the generation of quiet-day curves. These are the curves from which we measure geomagnetic activity and are of critical importance for AuroraWatch UK. There are are not flat but have a daily variation caused by the equatorial electrojet. The empirical algorithm selects the days (typically 5) with the least geomagnetic activity. A truncated Fourier series is used to guarantee that the quiet-day curves are cyclic, with the start and end points having the same magnitude and slope. This is essential otherwise our rolling plots would show up the discontinuities in the QDC at midnight, and would falsely cause step changes in the geomagnetic activity. An example QDC is shown below.

qdc
Quiet-day curve for magnetometer at Lancaster ,UK. This is derived from recorded data
and clearly shows the Sq current system caused by the equatorial electrojet.

From this we can see that even on a geomagnetically quiet day we would expect a 30nT variation in field strength seen by the magnetometer. The AuroraWatch threshold for minor geomagnetic activity is 50nT so this shows the importance of using a quiet-day curve instead of a flat line when calculating geomagnetic activity.

Stack plots

Stack plots (also called magnetograms) are a convenient representation for magnetic field data from a set of magnetometers separated in latitude.Data from the northernmost instruments is placed at the top and that from the southernmost at the bottom. An example stackplot is shown below:

20130920
Stackplot showing data from two Lancaster stations and from Ormskirk.
The magnetometer at Ormskirk is operated by the Met Office as part of a test. The stackplots will be more interesting as the network grows.

Open source

The source code is available under a BSD-type license from Github.You will need python, along with the numpy (version 1.7), matplotlib and scipy python modules.auroraplot has been tested under Debian Linux (64 bit version) and Raspbian on the Raspberry Pi.


Saturday, 18 May 2013

An open-access cloud-detection network

Introduction

Living in the North-West of England I find that my attempts to view the aurora or astronomical events such as meteor showers, lunar eclipses and comets are often prevented by cloud. On these occasions I wonder if it is worthwhile driving somewhere to find some clear sky. But where? If only I could look at a map to see where it was clear now. Publicly-available satellite images don't appear to have the resolution needed for this purpose. Maybe I should go to bed instead and wait for an alert when the skies have cleared? Could the question of where and when to find clear skies be answered by an open-access cloud detection network operated by citizen-science volunteers?

Requirements

I've together a draft list of requirements to construct a useful network:

  • Open-access. While my primary concern is with viewing the aurora I can see there are many other uses of such a network. Astronomy and obviously meteorology. Open-access enables other observers to make use of the data for their own purposes.
  • Near real-time. The weather here can quickly change. Ideally measurements should be taken every few minutes and be made available without unnecessary delay.
  • Use open-source hardware (OSHW). More specifically, an OSHW design should exist which allows users to contribute readings with the lowest possible cost.
  • Large geographical coverage. 
  • Night time operation required, day time beneficial.
The most difficult requirement to satisfy is the coverage. With ground-based sensors the viewing area might be as small as 2km diameter (cloud-base 1000m, optical viewing angle ±45°); at this size complete coverage of Great Britain would require over 57000 installations. A useful network does not require complete coverage, for auroral and astronomical purposes good results could be achieved by positioning sensors in a few viewing locations selected for low light pollution.

Remotely-sensing clouds

Perhaps the simplest method to remotely-sense cloud cover is to measure the 'sky' temperature with a non-contact infra-red (IR) thermometer. In the absence of cloud cover this is very low (say -12 to -20°C for Spring in the UK) but with cloud cover the temperature measured is warmer (0 to 4°C). These temperatures vary over the course of the year but by looking at the difference between the sky and ambient ground-level temperatures an estimate of cloud cover is possible. Some of these thermopile sensors have a digital output for interfacing directly with a microcontroller.

A camera and image-recognition software is another approach but it is more complex to develop, install and operate. It is not clear how such a system would perform at night. In order to install the maximum number of sensors I plan to concentrate on cheaper methods.

Design concept

I believe there are two key factors which limit the number of sensors in the network: cost and ease of installation. To minimise the infrastructure I plan to begin with a battery-powered unit which communicates with a Raspberry Pi (or other computer) via a low-cost, licence-free radio module. This is the same concept used by the AuroraWatchNet magnetometer sensors.


Potential problems

Precipitation (rain, snow, hail) and dew on the sensor will prevent accurate sky temperature measurements, most likely indicating cloud when it may in fact be clear. A heater to prevent dew forming is an option but the temperature gradients may cause the thermopile to give incorrect measurements. The power consumption needed is incompatible with battery operation. It may be possible to point the sensor downwards, to avoid precipitation and dew, and use a reflective metal surface to observe the sky. Tests shows the sky temperature readings are partially compromised by this approach.


Sensor

I have found a number of sensors which may be suitable:
  • Melexis MLX90614. This sensor contains thermopiles for sensing both the object and ambient temperature. An SMBus interface enables direct connection to a microcontroller. It is packaged in a TO-39 metal can. The standard 3.3V operation, 90° field of view (FOV) variant is readily available in single quantities from UK hobby electronics stores for around £15 each. Other variants exist for 5V operation and with different fields of view (10°, 35°, and a dual 70° FOV). The minimum object temperature is -70°C. The only irritation is that the sleep mode requirements are not compatible with low-power operation on a I2C bus.
  • Melexis MLX90615. Similar to the MLX90614 but the sleep mode requirements are compatible with low-power operation on an I2C bus. Cost is similar to MLX90614 but no UK supplier exists. Package is a TO-46 metal can. Limited to 3.3V operation and a single FOV (80° or 100° variants). The minimum object temperature is -40°C.
  • Texas Instruments TMP006. Small thermopile with I2C interface for direct connection to a microcontroller. Ball-grid array package. Readily available from UK suppliers. Cost is around £3 each for single quantities.
  • Thermometrics ZTP-135SR. Thermopile with analogue output in a TO-46 package, with a thermistor for ambient temperature measurement. Being an analogue output additional processing is required. Around £10 from Farnell.
  • Devantech TPA81. Linear array of 8 thermopiles. Cost is around £65.
  • Panasonic AMG88 Grid-EYE. An 8×8 imaging sensor in a surface-mount package. The minimum object temperature is -40°C. Available from Digikey for around $40.
For the prototype system I plan to use the Melexis MLX90614 sensor. It should be possible to work around the problems with low-power operation by using software I2C and powering the sensor from a logic output, allowing power to be completely removed when not in use.

I excluded the TMP006 because the BGA package is hard to work with; not only is it difficult to solder it will require some kind of enclosure or window to protect it from moisture. Only a few materials are transparent to long-wave infra-red emissions and the better ones are toxic, water-soluble or expensive. The other sensors may be suitable but are more expensive. The TPA-81 linear array and Grid-EYE imaging sensor could provide spatial discrimination and thus distinguish between a thin layer of complete cloud cover and denser clouds with open areas of sky.

Initial results

Initial tests with the Melexis MLX90614 sensor confirm the concept is viable. I have not noticed any ill-effects from the sun within the field of view, suggesting that daytime operation is possible. Further work is required to package the system into a usable prototype which can be deployed outside permanently. Full-time operation will indicate the frequency of measurement errors from dew and precipitation.

Other work

It would be wrong to suggest I am the first to make measurements of cloud cover in this way, useful links are listed below. I am not aware of any existing cloud detection networks.

Useful code for interfacing the MLX90614 IR thermometer with an Arduino. This code works with my Calunium Arduino clone.

Good background information.

http://kcotar.org/arduino-weather-station-1/
A weather station which uses the Melexis MLX90614 sensor for cloud detection.

http://www.noao.edu/staff/gillespie/projects/cloud-detector.html
Similar in concept but using a Peltier device (in reverse) to measure the difference between ambient ground temperature and sky temperature.


Sunday, 3 March 2013

Three-axis sensor unit for AuroraWatchNet

Three-axis magnetometer sensor unit
Three-axis sensor unit. The RJ-45 connector is for power and I2C data signals, not Ethernet.

AuroraWatchNet is a network of magnetometers for auroral alerts and citizen science. Whilst the  magnetometer is intended to function with one single-axis FLC100 sensor from Stefan-Mayer Instruments I have designed the system to support 3-axis operation by mounting 3 sensor boards at 90° to each other using just standard right-angle PCB connectors. This approach avoids the requirement for external mounting hardware which would be expensive to manufacture.

The power supply (a charge-pump DC-DC converter), temperature sensor and RJ-45 connector are fitted to just one circuit board. It is possible to use only one analogue-to-digital converter (ADC) but given their low cost it was presumed they would be fitted to all boards to enable simultaneous sampling of all 3 axes. The MCP3424 converter was chosen because eight options are available for the I2C address, thus jumpers can be fitted to select a unique address for every ADC on the I2C bus. This converter also features 4 input channels. All magnetometer outputs and the temperature sensor are connected to each ADC so that the spare channels can provide some redundancy in case of an ADC failure. The SYNC connectors of all sensors are linked to synchronise their excitation frequencies.

Several single-axis units have been built and one is in active use by AuroraWatch UK. The photograph above shows the first three-axis unit to be built. Initial testing indicates it functions as intended but the performance of 3 simultaneously-powered sensors in close proximity is yet to be established.


Saturday, 10 March 2012

E-mail delivery times observed by AuroraWatch UK

Following a comment by one of the AuroraWatch UK followers on Facebook I decided to analyse the AuroraWatch UK email statistics to investigate the variations in delivery times between email providers. It's important to understand that AuroraWatch UK doesn't make predictions but sends out alerts when geomagnetic activity exceeds preset levels. Prompt email delivery is therefore essential for AuroraWatch UK and its email subscribers.

The table below lists the top 30 email domains by number of AuroraWatch UK subscribers. For each domain the worst-case delivery time observed is given.

DomainNumber of subscribersWorst-case delivery timeComments
blueyonder.co.uk72500:05:16
mmail.co.uk34100:05:17
lancaster.ac.uk11400:05:18
live.co.uk32500:05:19
o2.co.uk18900:05:20
tesco.net25000:07:48
btconnect.com14100:07:51
lineone.net18900:07:53
talktalk.net47600:07:54
mac.com22600:07:54
me.com16700:08:45
bigfoot.com10200:09:18
hotmail.co.uk214400:13:15Edit: Similar delays to Yahoo observed in February 2014.
tiscali.co.uk81900:13:26
googlemail.com113800:14:08
gmail.com506400:14:13
ntlworld.com122600:14:16
supanet.com9700:15:25
orange.net11900:15:26
fsmail.net11300:15:28
virgin.net66900:15:33
msn.com35900:15:34
hotmail.com631700:15:53Edit: Similar delays to Yahoo observed in February 2014.
sky.com48200:19:09Uses Google
Edit: as of 2014 uses Yahoo!
aol.com272700:39:47
talk21.com32401:19:12Uses Yahoo!
btopenworld.com49202:44:05Uses Yahoo!
Edit: as of 2014 uses CP cloud, delays much reduced.
btinternet.com387002:48:59Uses Yahoo!
Edit: as of 2014 uses CP cloud, delays much reduced.
yahoo.com131905:29:17
yahoo.co.uk263405:31:11
Total32433

Statistics are based on the AuroraWatch red alert sent 2012-03-09. Failed delivery emails (no such address) are excluded. The worst-case delivery time is computed as the difference between the time of the first delivery attempt and last successful delivery, to reduce the effect of the AuroraWatch UK mail queue. The total number of email addresses on the list was 47486; the first 30 most popular domains cover 69.83% of the subscribers.

Note that it takes a finite amount of time for the AuroraWatch UK email server to work its way through the email lists. It is not meaningful to make comparisons between email providers for worst-case delivery times of less than 20 minutes since the measured performance is highly-dependent on the order the AuroraWatch UK server processed the email addresses. Longer delays are caused by email providers temporarily rejecting legitimate emails for defence against spam. Yahoo's performance is hit particularly badly by their choice to employ this practice.

The original spreadsheet is available on Google documents.